First Quarter 2026 Market Commentary
- 2 days ago
- 14 min read
Major Index Performance (Total Returns)
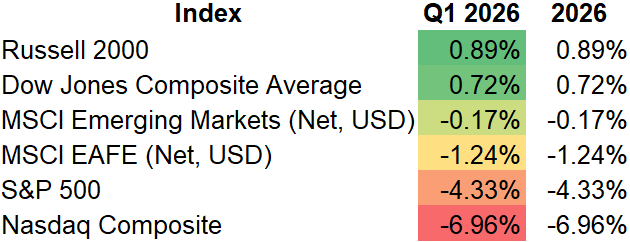
To kick off the year, US small cap stocks took the pole position, returning 0.89%. Not impressive by itself, mind you, as this annualizes to only a 3.56% return for the year, but it is interesting to see small caps outperforming large caps. Two explanations come to mind for why small cap outperformance occurred in the first quarter. First, the Iran War, and more specifically the closing of the Strait of Hormuz, disproportionately helped the energy, industrials, and materials sectors, toward which the Russell 2000 carries a larger relative weighting in aggregate (versus the S&P 500). Second, small caps look attractively valued relative to large caps on commonly used price multiples. The Russell 2000 is currently trading around 20x earnings, whereas the S&P 500 is trading around 30x as of writing. So, given that relative value discount, paired with growing concerns over artificial intelligence (AI) growth and improving fundamentals in more heavily weighted sectors, it makes sense that investors may have opted for small caps over large caps — at least for the moment.
I believe the same factors that explain small cap outperformance also apply to the Dow Jones, which returned 0.72%. Using the S&P 500 as a benchmark, the Dow Jones carries a higher weighting toward the sectors that performed well in the first quarter — energy, materials, and industrials — and is more reasonably valued on price multiples. Given that combination of better fundamentals and better value, it makes sense that the old-economy Dow Jones outperformed the S&P 500 and Nasdaq indices, which have a heavier weighting toward newer-economy technology stocks.
Emerging market stocks ended essentially flat, declining 0.17%. But looking under the hood at individual country performance, there was notable disparity in Q1. At the top, South Korea returned 26.53%, which is somewhat surprising given how technology-heavy the South Korean stock market is and how sharply that sector sold off in the United States. At the other end of the spectrum, India declined 13.34%, which makes sense given the country's heavy reliance on oil and gas imports. We will discuss both countries in more detail in the emerging market country performance section.
The MSCI EAFE, the primary international developed market benchmark, declined 1.24%. Australia was the strongest performer, gaining 5.99%, while Germany was the biggest drag on index performance, declining 6.66%. We will discuss both in more detail in the developed market country performance section. As with the trends discussed above, the Iran War was a major factor in explaining performance across the board.
The S&P 500 returned a negative 4.33%, driven overwhelmingly by weakness in the heavily weighted technology and communication services sectors, which fell 7.58% and 5.53%, respectively. Both sectors saw their worst month in March, which makes sense given that the Iran War officially began on the last day of February.
Given that sector performance, the Nasdaq Composite was the biggest laggard among major indices, declining 6.96% and finishing as the weakest performer for the first quarter.
U.S. Sector Performance

In what should come as no surprise to anyone who has been watching oil prices, energy was by far the strongest performing sector, returning 37.90%. This marks the sector's best quarter since Q1 2022, when it returned 37.73%. Just as geopolitical conflict was the primary driver of strong sector returns back then — namely, the Russia-Ukraine war — the Iran War, which began in late February, was the dominant catalyst behind energy's exceptional Q1. While natural gas declined around 3% in the first quarter, WTI crude oil surged, appreciating 83.35% for the quarter and 51.27% in March alone.
The next best performing sector was materials, returning 10.67%. The strong performance here was also tied to rising oil prices, which we will explore in depth when discussing LyondellBasell Industries (LYB) and Dow, Inc. (DOW). To summarize: the top performing materials companies benefited from using natural gas, rather than oil, as an input for producing end-use materials and chemicals. Oil is the primary input for large chemical companies internationally, whereas in the United States, natural gas fills that role. This gives US materials companies like LYB and DOW a structural cost advantage over their international peers. Since all of these companies are selling largely the same end products — primarily plastics-based materials — that cost advantage translates directly into improved profitability for US producers.
Utilities rounds out the top three, returning 8.24%. The sector served as the primary defensive play in the first quarter, as investors rotated away from high-growth AI stocks and into companies with more predictable earnings streams. Undeniably, the Iran War contributed to a broader sentiment shift, nudging investors away from higher-risk sectors like technology and toward more defensive ones like utilities. This same dynamic is a key reason why consumer staples — the fourth strongest sector — also performed well in Q1. However, the utility sector's strength was not purely defensive. Despite technology stocks falling primarily on valuation and narrative concerns, utilities also attracted interest as a picks-and-shovels play on AI, given that many utility companies stand to benefit from the surging energy demands of AI data centers.
On the other end of the spectrum, financials dropped 9.40%. The sector is essentially a leveraged bet on the US economy, and with concerning data on GDP, inflation, and employment all pointing toward a slowdown, sentiment soured accordingly. When expectations for economic strength fail to materialize, economically sensitive sectors like financials tend to suffer. Adding to the pressure, there have been growing concerns about the $1.8 trillion private credit market, to which banks carry both direct and indirect exposure. Finally, the Fed was widely expected to have begun cutting rates by now — an important variable for banks, which borrow short and lend long. When the anticipated reduction in borrowing costs fails to materialize, bank profitability suffers, and so do their shares.
S&P 500 Top/Bottom Performers
First Quarter/Year to Date

LyondellBasell Industries (LYB) and Dow, Inc. (DOW) – Feedstock, Crack, and Omelettes
LyondellBasell and Dow are two of the largest chemicals and materials companies in the world. The reason they have been paired together here is simple: they are the top two performing stocks in the S&P 500, and the reasons for their strong performance are the same. Feedstock and crack.
Feedstock is essentially a raw material that a manufacturer uses to produce something else. Think of an egg as a raw material — apply some heat (analogous to cracking, in our example), add other ingredients, mix it all together, and you get an omelette. The same basic logic applies to chemical companies when producing specific materials and liquids, though the process is obviously more complicated — and far less tasty — than making an omelette.
This is where the analogy breaks down. In the petrochemical business, a company can choose to use either natural gas or crude oil when refining certain chemicals, whereas when making an omelette, an egg is your only option. But that choice between natural gas and crude oil is precisely what drove LyondellBasell's and Dow's strong performance. Both companies primarily use natural gas to produce end-use products, while their international competitors primarily use crude oil. With crude oil prices having exploded and US natural gas remaining roughly flat on the year (down around 3.00%), the input costs for oil-based chemical producers have surged while those for natural gas-based producers have stayed largely the same. When two groups of companies are selling the same product, the one with lower input costs holds a massive advantage — and that is exactly the situation here.
So what are these companies selling? Plastics, or polyethylene if you want to be precise. Plastic prices have risen sharply since the war began, and in some regional markets they have actually hit all-time highs, greatly benefiting LyondellBasell and Dow. To put it all together: input costs for LYB and DOW have remained relatively stable while those of their global competitors have risen significantly, yet the market price of the final product has increased substantially for everyone. This dynamic is highly favorable for competitive positioning and profitability — which is why it comes as no surprise that both stocks have moved meaningfully higher to start the year.
Applovin Corp. (APP) – When Valuations Get Ahead of Themselves
A market darling just a couple of quarters ago, Applovin has since become the worst performing stock in the entire S&P 500 for the first quarter of the year — a classic case of valuations getting ahead of fundamentals, even when those fundamentals are genuinely strong. To illustrate, Applovin actually beat fourth quarter revenue and earnings expectations when results were released in February, yet the stock fell 20% the following day. As a reminder, Applovin's business model centers on connecting mobile app advertisers with publishers through its proprietary AI platform.
In addition, Applovin faced other headwinds. First, the stock has been in the crosshairs for short sellers, which has been a drag at investor confidence. Next, in the fourth quarter of 2025, the SEC opened an investigation into the company's data collection practices which remains unresolved. And then finally, the February launch of CloudX, a startup whose founders previously built core pieces of technology that Applovin later acquired, spooked investors who feared the new entrant could disrupt Applovin's dominance in mobile advertising. It is worth noting that CloudX's founders have framed their product as additive to the market rather than a direct replacement for Applovin — but the market, understandably, treated the emergence of well-credentialed competition as a threat.
Taken together, these factors created a stock that the market decided was priced for perfection in an environment that had become anything but.
International Indices
Developed Markets

Australia, an economy heavily driven by commodity performance, was the strongest international developed market performer, returning 5.99%. The Iran War and its impact on commodities — particularly oil — provided a significant tailwind for the Australian economy. This dovetails into another key point: financials make up a large component of Australia's stock market. Since a stronger commodity-driven economy tends to lift the broader economic outlook, and financials are closely tied to the underlying health of an economy, the Australian financial sector was a natural beneficiary of rising commodity prices. The transitive property at work!
Germany, on the other hand, declined a biblical spooky 6.66%. To briefly recap 2025: Germany was the strongest performing international developed market for the full year, but was the worst performing in the fourth quarter following an unexpected contraction in Q2 GDP. Third quarter GDP did little to help sentiment, with growth stagnating at a flat 0.00%. Given Germany's strong stock market performance throughout the year set against a backdrop of disappointing economic data, profit-taking in German equities was likely — and that pressure appears to have carried over into the first quarter of 2026.
Adding to Germany's headwinds, recall that US chemical companies benefited in part at the expense of international competitors that rely on oil as a feedstock in their chemical cracking process. Germany has a significant number of those companies. As oil prices surged and squeezed their input costs, these stocks suffered on expectations of compressed margins and lower profitability.
Emerging Markets

South Korea continued its strong 2025 performance by rallying 26.53% in the first quarter.
Bucking the general first quarter trend of technology sector weakness, Samsung and SK Hynix continued to rally, each gaining over 50.00%, driven by their dominance in the dynamic random access memory (DRAM) space — a key input in AI infrastructure. Since both companies make up approximately 45.00% of the MSCI South Korea index, the index essentially rises and falls with current DRAM profitability and future expectations for the segment. The disconnect between US market concerns over AI and the performance of Samsung and SK Hynix is notable, as one would expect the two to be more closely correlated. A valuation angle is worth considering: South Korea trades at roughly 17x earnings compared to the S&P 500's approximately 30x multiple at the time of writing. Investors who were cautious about US valuations but still wanted AI exposure may have viewed South Korea as an attractive longer-term alternative.
Brazil is also worth highlighting, and the explanation for its strong start to 2026 is probably exactly what comes to mind when you think about the Brazilian economy: oil prices. Brazil's economy and stock market are heavily influenced by crude oil, and with prices up over 80.00% in the first quarter, sentiment on Brazil improved meaningfully. To illustrate the point, Petrobras (PBR) — a majority state-owned oil and gas multinational that makes up approximately 15% of Brazil's index — appreciated over 70% in the quarter.
At the other end of the spectrum, India's index fell 13.34% in the first quarter. Here too, oil prices were the primary driver, but in the opposite direction: India is one of the world's largest oil importers, with estimates suggesting the country sources approximately 85% of its oil needs from abroad. Where higher oil prices represent a net economic benefit for countries like the US and Brazil, they represent a net cost for countries like India. It is no surprise, then, that sentiment soured and investors sold out of Indian equities.
U.S. Fixed Income
The Yield Curve

Yields rose across the curve, with the most dramatic movements occurring in the 1–5 year range. This rise in intermediate yields was undoubtedly driven by heightened inflation concerns stemming from the Iran War. Higher inflation expectations will, on their own, push yields up — but they also make it more difficult for the Federal Reserve to cut rates, creating something of a "damned if you do, damned if you don't" scenario for the Fed. If the Fed expects inflation to rise meaningfully in the near term — as it did in March, when inflation came in at an annualized 10.38% — it will be reluctant to lower rates, given the risk of allowing accelerated inflation to take hold. On the other hand, if inflation begins to normalize on the view that the oil price spike was an extraordinary, one-time event, keeping rates elevated could risk choking off economic growth. The Fed, in short, finds itself in a difficult position as a direct consequence of the Iran War. Markets appear to be pricing in the net effect of these competing forces — higher inflation expectations alongside an uncertain rate path — which is pushing yields higher, particularly over the intermediate term.
The Credit Curve

The credit curve behaved as expected given that US equity markets broadly declined in the first quarter. The most credit-sensitive securities — those in the CCC or below segment — saw the largest yield increases, while those with near-perfect credit quality (AAA) saw the smallest.
Fixed Income Fund Performance

Given that yields rose across both the maturity spectrum and credit quality ratings, it is unsurprising that holding cash was the best-performing strategy in the first quarter. As a reminder, yields and prices move inversely — when yields rise, prices fall.
The U.S. Economy

US GDP grew at a tepid annualized pace of 0.48% in the fourth quarter, decelerating sharply from the revised 4.32% annualized rate achieved in the third quarter of 2025. This slowdown was primarily attributable to a meaningful pullback in government spending, which declined 1.44% (5.77% annualized) in the quarter — largely a consequence of the government shutdown that began in early October and ended on November 12, making it the longest in US history at the time. Of note, it's estimated that the federal government shutdown shaved approximately 1.0% off of overall GDP numbers. However, it's likely that troubling figure will rebound when first quarter GDP numbers are released.
Personal consumption, the largest component of GDP, held up relatively well, driven in large part by continued spending among affluent households. One telling statistic: the top 10% of earners account for approximately 50% of all US consumer spending. This helps explain why headline GDP has remained resilient even as the average household contends with elevated inflation and a deteriorating job market.

The unemployment rate edged down from 4.40% to 4.30% year to date. While positive when looking at the unemployment rate in isolation the details behind the decline are more concerning than headlines suggests. The rate did not fall because more people found jobs; it fell because the labor force participation rate declined. In other words, more people are giving up on finding work and exiting the labor force than are actually gaining employment.
To explain the mechanics: the unemployment rate is calculated by dividing the number of unemployed individuals by the total labor force and multiplying by 100. When someone exits the labor force entirely, they are removed from both the numerator and the denominator — but because their removal disproportionately reduces the numerator, the unemployment rate can fall even as underlying labor market conditions deteriorate. Viewed in isolation, the headline number masks the reality.

Payroll growth in the first quarter was weak by historical standards, though it represented a modest improvement over 2025 averages. Some drag from federal government job cuts was offset by healthy hiring in the healthcare sector.
To summarize: the labor market started 2026 in better shape than 2025 averages would suggest, but it remains sluggish and uneven — and when paired with a shrinking labor force, the underlying picture is concerning.

Nominal wages increased in the first quarter, but after accounting for inflation, real wages actually fell. Pay gains were outpacing inflation through the first two months of the year, but the March inflation spike — driven by the Iran War's impact on oil prices — reversed that trend.
One interesting data point from ADP research: the pay premium for switching jobs — the difference in wage growth between job-changers and job-stayers — has reached its lowest level in ADP's data going back to 2020. While five years is not a long track record, it is notable that the post-pandemic "quit and get a raise" dynamic, which at its peak produced pay increases of around 8.40%, has compressed to just 1.90%. This implies that workers have meaningfully less negotiating leverage than they did even a few years ago. It also raises the question of whether AI is beginning to weigh on hiring, as employers may be choosing not to backfill open positions in favor of deploying AI tools instead.

Consumer prices rose sharply in the first quarter, driven largely by the March reading of 0.87% — which annualizes to a staggering 10.44% (0.87% x 12). Oil prices were clearly the primary factor, as confirmed by the core inflation figure for the quarter, which rose a more modest 0.71% (2.83% annualized).
With crude oil prices having pulled back somewhat when they peaked at over $100 in late March, another 0.87% monthly print seems unlikely in the near term. That said, inflation is expected to remain above 3.00% as companies begin passing higher input costs — particularly fuel — through to consumers.
Quick Hits
Dubbed the "SaaSpocalypse," the S&P Software & Services Select Industry Index declined 23.94% in the first quarter, driven by fears that agentic AI — such as the tools being developed by OpenAI and Anthropic — would displace enterprise software subscriptions.
Gold appreciated 27.28% to close at an all-time high of $5,524 on January 29th, before then declining to finish the quarter at $4,511. This represents a 3.94% return for the quarter.
The ICE US Dollar Index appreciated 1.58% in the first quarter after declining 9.40% in 2025. In March alone, the dollar rallied 2.24%.
Major defense companies, namely Lockheed Martin, RTX, and Northrop Grumman, returned 25.60%, 20.03%, and 5.53% respectively in the first quarter.
The Dow crossed 50,000 for the first time in history on February 6th, 2026. Pam Bondi, the former attorney general, nearly top ticked the Dow during her testimony on February 11th, when she deflected questions regarding the Epstein files and exclaimed "The Dow is over 50,000 right now!" The Dow then declined 7.54% to finish the quarter at $46,342.
This commentary is prepared by and is the property of EID Capital, LLC and is circulated for informational and educational purposes only. There is no consideration given to the specific investment needs, objectives, or tolerances of any of the recipients. Additionally, EID Capital's actual investment positions may, and often will, vary from its conclusions discussed herein based on any number of factors, such as client investment restrictions, portfolio rebalancing and transactions costs, among others. Recipients should consult their own advisors, including tax advisors, before making any investment decision. This material is for informational and educational purposes only and is not an offer to sell or the solicitation of an offer to buy the securities or other instruments mentioned. This material does not constitute a personal recommendation or take into account the particular investment objectives, financial situations, or needs of individual investors which are necessary considerations before making any investment decision. Investors should consider whether any advice or recommendation in this research is suitable for their particular circumstances and, where appropriate, seek professional advice, including legal, tax, accounting, investment, or other advice.
The information provided herein is not intended to provide a sufficient basis on which to make an investment decision and investment decisions should not be based on simulated, hypothetical, or illustrative information that have inherent limitations. Unlike an actual performance record simulated or hypothetical results do not represent actual trading or the actual costs of management and may have under or overcompensated for the impact of certain market risk factors. EID Capital makes no representation that any account will or is likely to achieve returns similar to those shown. The price and value of the investments referred to in this research and the income therefrom may fluctuate. Every investment involves risk and in volatile or uncertain market conditions, significant variations in the value or return on that investment may occur. Past performance is not a guide to future performance, future returns are not guaranteed, and a complete loss of original capital may occur. Certain transactions, including those involving leverage, futures, options, and other derivatives, give rise to substantial risk and are not suitable for all investors. Fluctuations in exchange rates could have material adverse effects on the value or price of, or income derived from, certain investments.
EID Capital research utilizes data and information from public, private, and internal sources. While we consider information from external sources to be reliable, we do not assume responsibility for its accuracy.
This information is not directed at or intended for distribution to or use by any person or entity located in any jurisdiction where such distribution, publication, availability, or use would be contrary to applicable law or regulation, or which would subject EID Capital to any registration or licensing requirements within such jurisdiction. No part of this material may be (i) copied, photocopied, or duplicated in any form by any means or (ii) redistributed without the prior written consent of EID Capital, LLC.
The views expressed herein are solely those of EID Capital as of the date of this report and are subject to change without notice.


Comments