First Quarter 2025 Market Commentary
- Apr 15, 2025
- 13 min read
Major Index Performance

Major indices’ first quarter performance was pretty much a mirror image of 2024’s full year performance. The laggards became leaders and highflyers came back down to earth. Is this just a temporary anomaly or a sign of things to come?
Collectively the developed countries across the globe not named the United States posted a 6.86% return and were the best performing equity markets in the first quarter. Given U.S. stocks were trading pretty rich throughout the quarter, investors likely told themselves, “That’s too high a price to pay—no matter how great the company,” and looked for better bargains abroad.
Next, the basket of lesser developed emerging market equities finished second, yielding 2.93%. A mix of expansionary monetary and fiscal policy actions, positive commodity performance, and a positive tech development out of China largely explained emerging markets Q1 performance. We’ll discuss the China development shortly.
Then comes the United States, which stumbled out of the gate as no single major U.S. index finished the quarter in the green. The Dow Jones Composite, which broadly represents older economy stocks, declined 1.52%. The S&P 500, which is made up of old and new economy stocks, fell 4.27%. Then, small caps experienced a significant drop, falling 9.48% to kick off the year. Undoubtedly, the uncertainty coming out of Washington and its heavy-handed protectionist rhetoric caused some discomfort for U.S. based investors.
And lastly after being the best performing index in 2024 the growthier Nasdaq Composite ended last to start the quarter, falling 10.26%. On top of the uncertainty coming out of Washington, cracks are beginning to show in AI’s narrative. China-based company DeepSeek developed an AI model that performs better than ChatGPT but at a fraction of the computing power, heavily impacting AI capex expectations. In addition, investors are now more critically pondering: “How will AI be monetized?” and “Can these applications generate enough profit to justify the massive investment?” The increased scrutiny on AI's return on investment undoubtedly played a part in the Nasdaq’s underperformance.
U.S. Sector Performance

The energy sector shined the brightest in Q1, returning 9.94% and outperforming the broader S&P 500 by 14.20%. This undoubtedly came, in part, from the administration’s policy agenda which included slashing regulation for O&G producers. The sector’s strong performance was also due to natural gas appreciating 30.38%, which obviously boosted earnings expectations. It is the oil and gas sector after all.
On the other end of the spectrum, the technology and consumer discretionary sectors were the primary culprits that dragged down the S&P 500 to start the year. Technology, as mentioned previously, was beaten down by investors reassessing their assumptions regarding AI spending and return on investment. Since the sector had rich multiples to start the year, a little disappointment here or concern there can send shares sharply downward. Nvidia, the poster-child for the AI theme, fell 19.29% in Q1 and currently sits 36.86% below its all-time high. Amazon, categorized as a consumer discretionary stock, felt the impact of this as well as the company is also investing significantly for its own AI ambitions. It was down 13.28% in Q1.
However, the consumer discretionary sector’s poor outing was mostly attributable to one company. Tesla.
S&P 500 Top/Bottom Performers
First Quarter

Tesla Inc (TSLA) – “Democrats Buy Teslas Too”
As mentioned last quarter, Tesla rallied significantly in Q4, returning approximately 60% since election day (November 5th) which represented a $498B increase in market value. If you recall, I openly questioned how exactly Tesla would benefit to the tune of $498B from Elon’s relationship with the president. The market, reassessing the answer to this question, sent Tesla’s shares right back down to earth. In the end, the market came to the same conclusion I had: it wouldn’t.
Elon didn’t learn the wisdom that Michael Jordan knew long ago. There is a very real cost to involving yourself in politics. As a result of Elon’s antagonizing, Tesla’s sales and earnings fell in 2024 and currently many people are trading in or selling their Teslas in protest. Although Tesla has already made money on these sales, it doesn’t bode well for the company's brand going forward. In addition, the Cybertruck looks like a massive flop. It’s had over eight recalls since its launch and Tesla is currently sitting on $200M worth of Cybertruck inventory.
To make matters worse, Chinese competitor BYD has developed higher-quality electric vehicles and is selling them at a lower price point than the Tesla model equivalent. Since China is a significant growth market for Tesla, it’s not a great sign that a local competitor has designed and manufactured a better product. After all, locals prefer to buy from their locale and a better value proposition makes the purchasing decision a no-brainer.
So, the dangers of betting on the jockey and not the horse certainly apply here. For all the spectacular things one person can do, they can just as easily unwind it. Here’s hoping Elon returns to his roots—building innovative products people want to buy.
CVS Health Corp (CVS) – A Shot in the Arm for Your Local Pharmacy?
CVS, one of the largest retail pharmacy chains in the U.S., saw a strong 52.76% Q1 reversal in stock performance after taking a -40.76% beating in 2024. Mentioned when discussing Walgreens last year, the pharmacy chain's bottom line is getting hurt by declining reimbursement rates paid to them from pharmacy-benefit managers. Basically, they’re getting paid less for each prescription they fill. In addition, many online pharmacy chains have cropped up, putting even more pressure on brick-and-mortar pharmacies, which require significant overhead that an online shop simply doesn’t have to worry about.
However, better-than-expected Q4 revenue and earnings paired with the appointment of a new CEO seems to have instilled confidence in the company’s strategic direction. Will the company be able to solve the structural headwinds that face it or is its recent performance simply a short-term positive blip on longer declining trend? We’ll see.
Philip Morris International Inc (PM) – All About the Upper Decky Lip Pillow (Zyn)
Philip Morris International, a company that has long been associated with cigarettes and other combustible tobacco products, is seeing a revitalization by betting heavily on smoke-free products. Their flagship smoke-free product, Zyn, has exploded in popularity and is now well ingrained in popular culture as the go-to product for getting a little buzz during on and off hours. In addition, the tobaccoless nicotine pouch has shown to help cigarette smokers quit, by trading one unhealthy addiction for another much less unhealthy addiction. This recently led the FDA to grant Phillip Morris the ability to market Zyn products in the United States as a safer alternative to smoking. To be clear, this doesn’t mean that they’re "risk-free" health wise.
Although the company doesn’t specifically say how much Zyn sells, its smoke-free revenue segment grew by 14.31% in 2024, mostly on the back of its nicotine pouch volume growing 52.93% over the same period. This was by far its fastest growing product line and a very smart pivot given cigarettes and other combustible tobacco products are in a structural decline. Here’s hoping news doesn’t come out that Zyn gives you cancer, else I’m in big trouble.
International Indices
Developed Markets

For developed countries outside of the United States, Germany was the strongest performer in Q1, rallying 16.53%. The country passed legislation that exempts military spending from budgetary caps and created a €500B fund to invest into the country's infrastructure. This obviously opened a massive amount of current and future capital investment into Germany’s economy which won't only benefit the country but the entire Eurozone.
In addition, the German market is simply cheaper relative to U.S. markets. At the beginning of the year, the MSCI Germany was trading at 14.57x earnings versus the S&P 500 trading at 29.30x. So, massive fiscal policy plus lower relative value naturally leads to investors showing renewed enthusiasm for German equities.
Australia was on the other end of the spectrum, down 1.76% for the quarter. This was mostly attributed to the Reserve Bank of Australia (RBA), Australia’s Federal Reserve equivalent, keeping interest rates steady and striking a hawkish tone in its commentary leading many to believe that they won’t be cutting rates anytime soon. This negatively impacted Australian stocks overall and dragged down the financial sector in particular. Unlike the S&P 500, the financial sector makes up a larger weight in Australia’s stock market.
Emerging Markets
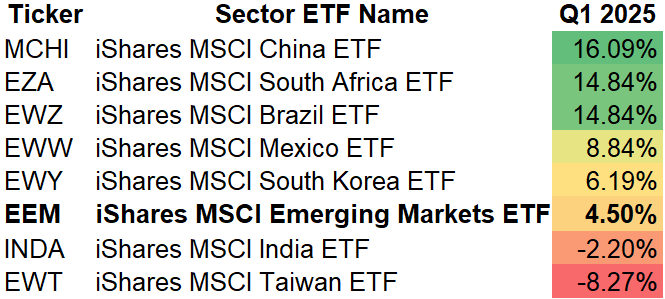
China was the best performing emerging market country in Q1, posting a strong 16.09% to start the year. The main story here is what I’ll call an AI pairs trade: long China, short United States. In January, China’s DeepSeek unveiled its LLM model that’s comparable to OpenAI’s ChatGPT in terms of speed and accuracy. However, the model was built and operates at a significantly lower cost than ChatGPT, both in terms of the number of chips needed to run and the amount of electricity needed to operate. This boosted enthusiasm for China’s tech companies, a lot of which rose significantly in Q1 and make up a large part of China's overall stock market.
In addition, China’s fiscal and monetary policy were very accommodative and easy, as they cut rates and injected liquidity into both China’s economy and financial markets.
When you have breakthrough technological innovations paired with fiscal and monetary stimulus, that’s a solid one-two punch that leads to strong market performance.
However, this AI pairs trade didn’t bode well for Taiwan, as seen by its index dropping 8.27%. As mentioned in previous commentary, Taiwan’s stock market is closely tied to Taiwan Semiconductor Manufacturing Co (TSM), which fabricates an overwhelming majority of the world’s semiconductors. Since DeepSeek demonstrated that a sophisticated AI model could be developed with far less computing power, investors revised AI spending expectations downward, heavily impacting expectations for TSM’s future profitability and growth. Taiwan Semiconductor Manufacturing Co (TSM) lost 15.61% in the first quarter.
U.S. Fixed Income
The Yield Curve

Interest rates fell across the curve, with the most significant declines occurring around the 5-year range. Treasury markets are likely anticipating the Federal Reserve will begin cutting rates sooner rather than later to combat any near-term declines in economic growth. This concern was likely driven from the seemingly random and heavy-handed proposed protectionist policies coming out of Washington, particularly as it relates to global trade. Given this, it makes sense that treasury markets would act this way with investors getting ahead of any uncertainty and investing in what’s considered a safe haven asset.
The Credit Curve

Given the increased economic uncertainty, it makes sense that credit spreads would also increase. We can see here credit spreads rose across all credit qualities, with the worse rated fixed income securities – CCC or Below – seeing the largest increase in spreads. This movement is confirmed by the U.S. stock market declines, which are highly correlated to credit spreads.
Fixed Income Fund Performance

So given everything I’ve described – interest rates falling and credit spreads rising – it’s not a surprise that the longest duration, highest quality fixed income securities performed the best. Now, you’d expect high yield bonds to perform the worst, but because interest rates fell enough to blunt the impact of rising credit spreads, this segment was able to eke out a gain over keeping money in a money market mutual fund (i.e., cash).
U.S. Economy

U.S. growth did slow a little bit in Q4 but not materially. Most of Q4 growth came from consumer spending, which makes up approximately two-thirds of U.S. GDP. However, private investment took a significant backwards step, falling by an annualized 5.72%, which is a significant concern. Government spending modestly slowed, and the trade deficit narrowed.

The unemployment rate modestly ticked up 0.10% to 4.20% in March. A small increase that we shouldn’t make too much noise about, however we’d obviously like to see unemployment trending downward.

Job figures were basically flat and in line with their year-over-year change. However, what’s more concerning is that the initial claims for unemployment exploded in the past three months. This doesn’t bode well for the unemployment situation we just discussed.

However, a positive sign is that incomes broadly increased. This suggests that if you were employed, you likely saw a nice pay bump. However, this could be seasonal since many companies typically give raises at the end of the year.

Consumer prices are technically accelerating and we obviously want to see prices falling, given they don’t fall at a time when the economy is doing the same. But a three-month annualized change of 2.74% isn’t overly concerning. Yes, it's above the Fed’s target of 2.00%, however, 2.74% is below the long-term average of around 3.00%.
Consumer prices are going to be the most interesting economic metric to look at in the coming months with Washington introducing sweeping tariffs, which by their very nature, are inflationary. Will tariffs lead to a one-time bump in prices or could they cause an upward inflationary spiral similar to what we experienced in 2022?

Broadly speaking, the residential real estate market is beginning to normalize, given existing and new homes for sale are increasing, sales are decreasing, which naturally caused home prices to fall. I believe home sellers are starting to realize that they won’t be able to sell at the all-time high prices they were likely anchored to in 2021 and are cutting their listing prices accordingly. After all, home buyers face a tough environment, with mortgage rates significantly higher now than they were prior to 2023.
Looking Forward
Tariffs (Duh)
I’ve had to rewrite this section numerous times. Initially I was discussing the uncertainty around tariffs before they were implemented. Scrap that. Then I had to discuss what was going on when the tariffs got implemented and markets were in free fall. Shred it.
This is what I get for not getting this commentary published quickly. Sheesh.
Now as of writing this (April 10th), the country specific tariffs are on a 90 day pause for all countries not named China, whose tariffs are currently at 145%. However, the universal 10% tariffs on all imports are still in place. Stock markets initially went to the moon after this announcement but now they are falling again.
Tariffs will undoubtedly be the biggest fiscal policy development that will drive market volatility. I’m paying particularly close attention to see how the U.S./China trade war will shake out, with the expectation that it will get worse before it gets better. If positive news of agreements getting made comes out, I’d expect markets to rally, however, if the tit-for-tat exchange continues and it leads to escalatory actions outside of just trade (e.g., military escalation), I’d expect markets to fall further.
In addition, I feel many people are forgetting that the tariffs got suspended and aren’t necessarily off. It’s possible that markets are discounting this realization a little bit the day following the historic rally. So, it’s also important to see what deals get made between now and then and with what countries. Obviously, a trade deal that gets done with a larger country, like Japan, would have a bigger impact than one with a smaller country like, say, Ecuador.
The Vibes are Off
The country specific tariffs getting called off, except for China, has alleviated some stagflation risks, but stagflation is still a very real risk that’s top of mind for the Federal Reserve. Stagflation occurs when prices rise at a time when the economy is falling and the last time the United States experienced this was during the 70s and early 80s.
Speaking to inflationary risks, China is the top supplier of goods to the United States and accounts for 16.50% of total imports. So, since the tariffs are still in place for the country, and at a staggering 145% rate, it could still drive prices up enough that it shows up in the consumer price data. This could obviously spook consumers and businesses alike, and make them feel less comfortable with spending and investing.
Speaking to that, consumer and business confidence are extremely important to the U.S. economy. When we feel good and believe things are going to improve in the future, we’re more likely to open up our wallets to buy things. The same goes for businesses when making employment and capital investment decisions. However, when we’re feeling uncertain, anxious, or pessimistic about the future, we do the opposite. Consumers and businesses alike reduce their expenses and sock away money for a rainy day. This is problematic because if consumers spend less, businesses make less money, leading them to layoff people, which causes a reduction in the total income available to spend, leading to less spending, layoffs, and the cycle reinforces itself.
I bring this up because the whiplash of tariffs getting put on and then off paired with a highly volatile stock market doesn’t exactly create an environment of stability and certainty. As a result, I believe consumer and business confidence has deteriorated, consequentially causing an overall reduction in spending and investment. Keep in mind, the tariffs weren’t eliminated, they were simply paused. So, what’s going to happen 90 days from now? That’s more uncertainty everyone has to grapple with.
Because of this increased uncertainty, I expect all financial markets to exhibit higher volatility going forward than what we’ve experienced over the past few years. They will be more sensitive to all sources of information: economic releases, earnings reports, company guidance, news out of Washington and Beijing, and Fed commentary to name a few.
As far as economic releases are concerned, I believe inflation releases are the most important economic indicator in the near term, since I believe that the growth risks are mostly priced into asset prices. If inflation starts accelerating and doesn't show signs of abating, this would be the worst-case scenario for all financial assets in this manager's humble opinion. This commentary is prepared by and is the property of EID Capital, LLC and is circulated for informational and educational purposes only. There is no consideration given to the specific investment needs, objectives, or tolerances of any of the recipients. Additionally, EID Capital's actual investment positions may, and often will, vary from its conclusions discussed herein based on any number of factors, such as client investment restrictions, portfolio rebalancing and transactions costs, among others. Recipients should consult their own advisors, including tax advisors, before making any investment decision. This material is for informational and educational purposes only and is not an offer to sell or the solicitation of an offer to buy the securities or other instruments mentioned. This material does not constitute a personal recommendation or take into account the particular investment objectives, financial situations, or needs of individual investors which are necessary considerations before making any investment decision. Investors should consider whether any advice or recommendation in this research is suitable for their particular circumstances and, where appropriate, seek professional advice, including legal, tax, accounting, investment, or other advice.
The information provided herein is not intended to provide a sufficient basis on which to make an investment decision and investment decisions should not be based on simulated, hypothetical, or illustrative information that have inherent limitations. Unlike an actual performance record simulated or hypothetical results do not represent actual trading or the actual costs of management and may have under or overcompensated for the impact of certain market risk factors. EID Capital makes no representation that any account will or is likely to achieve returns similar to those shown. The price and value of the investments referred to in this research and the income therefrom may fluctuate. Every investment involves risk and in volatile or uncertain market conditions, significant variations in the value or return on that investment may occur. Past performance is not a guide to future performance, future returns are not guaranteed, and a complete loss of original capital may occur. Certain transactions, including those involving leverage, futures, options, and other derivatives, give rise to substantial risk and are not suitable for all investors. Fluctuations in exchange rates could have material adverse effects on the value or price of, or income derived from, certain investments.
EID Capital research utilizes data and information from public, private, and internal sources. While we consider information from external sources to be reliable, we do not assume responsibility for its accuracy.
This information is not directed at or intended for distribution to or use by any person or entity located in any jurisdiction where such distribution, publication, availability, or use would be contrary to applicable law or regulation, or which would subject EID Capital to any registration or licensing requirements within such jurisdiction. No part of this material may be (i) copied, photocopied, or duplicated in any form by any means or (ii) redistributed without the prior written consent of EID Capital, LLC.
The views expressed herein are solely those of EID Capital as of the date of this report and are subject to change without notice.


Comments